The tools we will describe here are the techniques and tools that Dr. Ishikawa, who developed the fishbone diagram among the quality-control techniques, recommended for use in quality control. As you know, Dr. Ishikawa is a Japanese scientist who has entered the world literature on quality control.
By using the 7 quality tools, you can carry out cause-and-effect analysis of your processes, monitor the course of production, and, by taking measures, prevent errors from occurring.
1-Graph
The graph is the foremost of the tools to be used. Every kind of data gains more meaning when it is turned into a graph. In this way, problems are made visual, and finding the problem is made possible.
2-Check Sheet or Classification
The second important tools are systems we can call the classification of errors, or a check sheet. With the help of this system, the errors that occur are classified, and the sources of the problems are determined separately for each class. Without classification, it is not possible to find solutions to the problems.
3-Pareto Diagram
The Pareto diagram is the classification of errors, and the efficient use of time and resources by focusing the available resources and time on those that make up the greater part of the error. Pareto analysis can be applied to every area of life, and it can also be used for quality control.
4-Cause&Effect Analysis (Ishikawa Diagram)
The Ishikawa diagram, which entered the Turkish literature as the "fishbone," is basically a diagram used to analyze the causes of an error and to eliminate those causes. What is done here, basically, is that all possible errors are written down by considering the 4M (Material, Man, Machine, Method), together with Environment and Measurement methods. The measures to be taken to prevent the errors are then put into practice.
5-Scatter Diagram
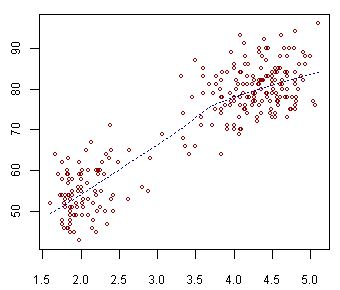
It is a diagram used especially to show the correlation between inputs and outputs. By revealing the connections between machine and system parameters, it helps us prevent errors. An important point to note is that, when selecting the parameters, the highest correlation may not always be the correct one. The scatter diagram is used as a very useful tool in the quality field because it shows the relationship between cause and effect.
6-Histogram (bell curve)
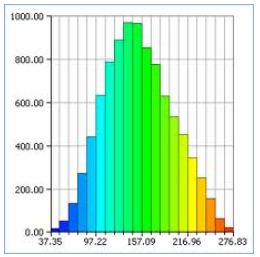
The use of histograms has become widespread especially as a result of limit values being set by the customer. The histogram is a widely used chart because it provides a great deal of information about outputs. Through the histogram, analyses such as capability analysis (CPK) and measurement-accuracy analysis (MSA) are carried out on a process.
7-Control Charts (X-R Chart)
With the help of control charts, a trend in a process can be identified and measures can be taken before an error occurs. For example, by monitoring critical dimensions after injection, the machine settings can be adjusted before the part goes out of tolerance. These tools are the most widely used tools in the quality-control system. With the help of these tools, in addition to determining the source of the error, scrap can also be prevented by monitoring the system trend and intervening before an error occurs.
